|
During my second CT observation, I did an enrichment activity on graphs. We had been learning about graphs for about two weeks so students were familiar with what they were. In our time studying graphs, they never had to collect their own data to make a bar graph. In this activity, students were given two fun size packs of M&Ms, a tally chart, and a graph template. Their first objective was to sort their M&Ms by color. They created piles of the color M&Ms on their desk and began tallying their totals. After they tallied, I asked students to write the number next to the tally groups that way they did not need to keep recounting their M&Ms during the activity. I think this helped them not make mistakes on the assignment as well. Once they showed me their data, I gave them their graph to color in. At the bottom of the graph, I worked in some math questions from our previous unit on fractions. I think this lesson went really well. Students were engaged the whole time and really enjoyed the activity. I thought that students were going to struggle with not eating the M&Ms but they did better than I thought they would with waiting until the end. I think it helped my usual students who struggle with completing assignments get the work done because they had a reward of M&Ms to eat at the end. I think this lesson really solidified their understanding of graphing data. Students were exposed to what it is like to collect and record data and how diverse the rest of the classes data was. No two graphs looked the same with the same amount of colors and they were surpised with that result. I definitely would do this lesson again. 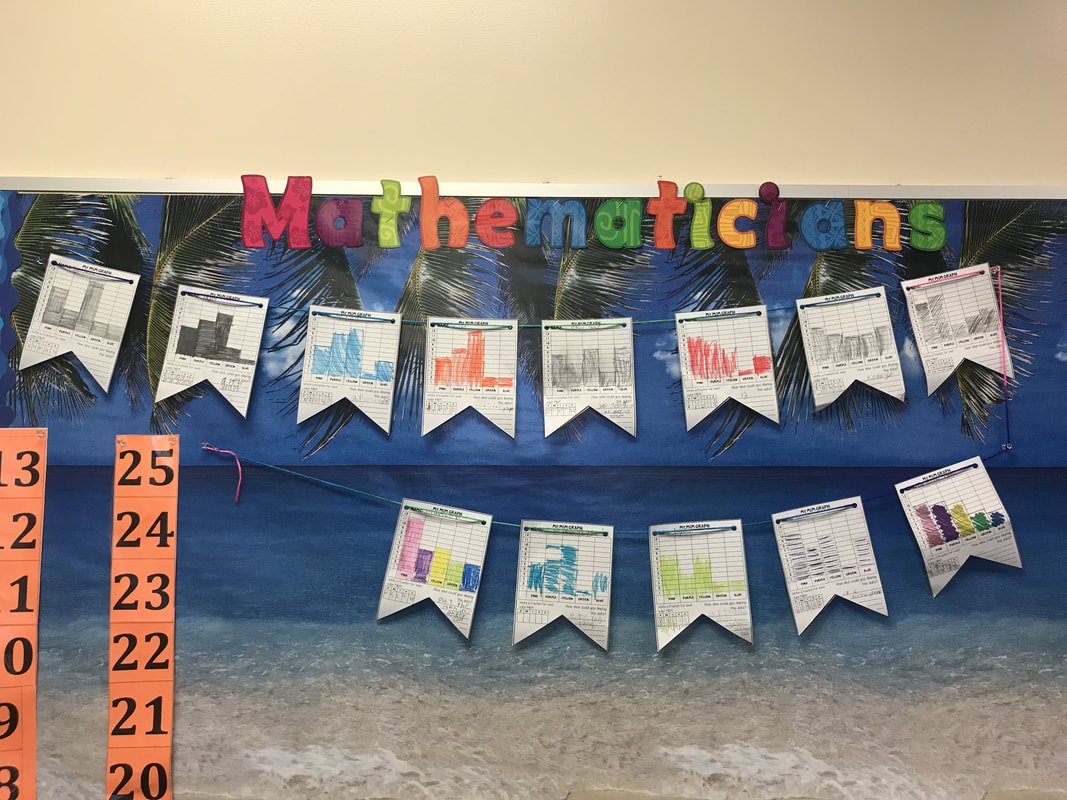
0 Comments
Leave a Reply. |
AuthorDanyelle Estill Archives
April 2018
Categories |
 RSS Feed
